By Dr. Jim MacRae, CASP Research Associate
Now that 2014 is behind us and Washington State is entering its second year enjoying a legal cannabis market, it is time to reflect on (and give a bit back to) the brave individuals at the vanguard of this nascent industry.
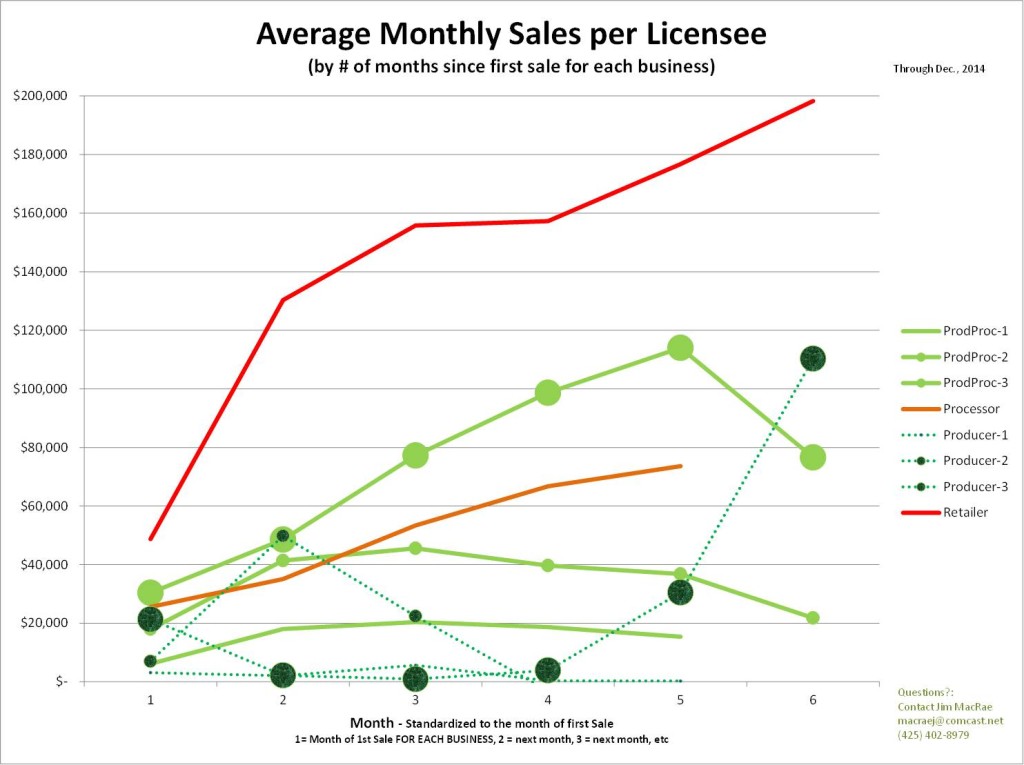
The attached chart is intended to stimulate thought and discussion amongst I-502 business operators, applicants, aspirants, supporters and legislators about the early revenue realities of operating a legal cannabis business in Washington State. It is also designed to be a useful initial benchmarking tool for legal cannabis business operators*. For example, if you are a Retailer that has been open for 3 months and you book $160,000 in month 3, you are in the minority (in a good way) vs. your peers.
As such, the only interpretation I’ll put on this (and your comments are welcome on what meaning YOU derive from the chart) is that both Tier 1 and Tier 2 producers that do not also have (or have not yet generated sales from) a processor license appear to be, on average, struggling in terms of generating reasonable levels of revenue. At a minimum, this suggests that having a very low cost of production will be crucial for such operations.
The chart contains averages, and there are businesses that are significantly exceeding these numbers. As such, if your business has sold more than these averages in any month since you opened, you can infer that you were doing better than the majority of I-502 businesses in the State at a similar interval following the month of their first sale.
All I-502 businesses that booked at least 1 sale in 2014 are represented in the attached chart. It is derived from individual licensee-level monthly sales reported by the WSLCB for calendar year 2014.
“Month” 1 on the chart is the first month in which each business booked a sale (so all businesses with a sale in 2014 are included here). Each subsequent “Month” is the next month of sales FOR EACH BUSINESS. As a result, each subsequent “Month” will include fewer businesses (e.g., “Month” 6 contains only those businesses that first reported sales in June or July).
We welcome your comments and discussion on what you see in these derived data. In the meanwhile, CASP is working on a comprehensive interpretive and predictive view of this marketplace, based on what happened during 2014.
Stay tuned …. It should not be too much longer coming.
*If you find utility in this that brings value to your business or plans and are able to, please find it in your heart to donate to CASP — we are a 501c(3), in case 280e doesn’t derail even that deduction. Some of the stuff we publish might just help with your production and, arguably, be classifiable as COGS.